5910 Breckenridge Pkwy Suite B, Tampa, FL. 33610
(800) 272-0707

SkillSoft Explore Course

Productivity & Collaboration Tools     Microsoft Office 365     Excel 365

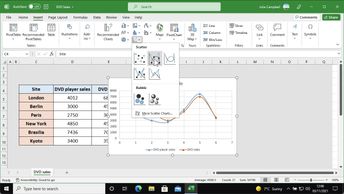
Analyze and present your Excel data in a more visually appealing way using Excel 365's various chart types. In this course, you will learn how to work with different chart types; and how to change a chart's appearance using the chart formatting tools. Next, you will learn how to edit a chart's data series and customize the chart's titles, labels, and axes. You will also see how to save a chart type or chart formatting choice as a template to make it easier to use and include in future spreadsheets.


Objectives

Excel 365: Creating advanced charts in Excel 365

  • discover the key concepts covered in this Creating advanced charts in Excel 365 course
  • create a bubble chart in Excel 365
  • create a radar chart in Excel 365
  • create a scatter chart in Excel 365
  • create a map chart in Excel 365
  • create a box and whisker chart in Excel 365
  • create a combo chart in Excel 365
  • create a funnel chart in Excel 365
  • create a histogram in Excel 365
  • create sunburst and waterfall charts in Excel 365
  • create a chart template in Excel 365
  • Knowledge Check: Creating advanced charts in Excel 365