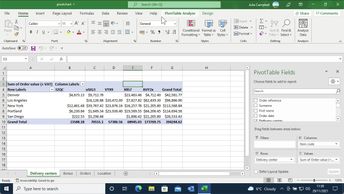
Excel 365 includes powerful tools to summarize data. In this course, you will learn how to create, edit, and format PivotTables and PivotCharts; and how to use slicers. Key concepts covered in this course include how to use a PivotTable to find trends in data, and how to add extra levels of detail and multiple value fields in a single table. Because a PivotTable is highly customizable, you will observe how to configure and customize its display and control settings. Next, you will examine how to use label and value filters to analyze data, how to use a slicer to filter data, and how to customize the appearance of a slicer. Finally, you will explore how to use data from a PivotTable to create a PivotChart and then customize and format the PivotChart.
| Objectives |
|---|
Excel 365: Creating PivotTables and PivotCharts in Excel 365
|


