5910 Breckenridge Pkwy Suite B, Tampa, FL. 33610
(800) 272-0707

SkillSoft Explore Course

Collections     Essentials     Microsoft Office 2013: Intermediate Excel (No Assessments)

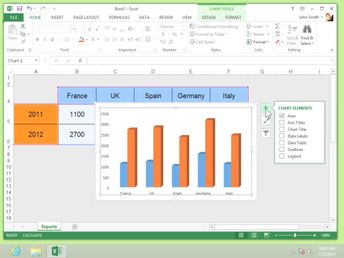
Display your data visually using Excel's built-in charting features. Learn how to insert, label, and format a chart; create various types of charts; combine types of charts; create comparative charts; and insert and customize trendlines.


Objectives

Excel 2013: Charts & Graphics

  • Inserting a chart
  • Labeling a chart
  • Formatting a chart
  • Customizing your chart axes
  • Creating a chart template
  • Presenting negative values in your chart
  • Creating a pie chart
  • Creating a scatter chart
  • Creating a bubble chart
  • Creating a radar chart
  • Combining two types of chart
  • Creating a comparative chart using symbols
  • Inserting trendlines
  • Customizing your trendlines