5910 Breckenridge Pkwy Suite B, Tampa, FL. 33610
(800) 272-0707

SkillSoft Explore Course

Desktop Certifications     Isograd     TOSA Desktop     TOSA Excel 2016

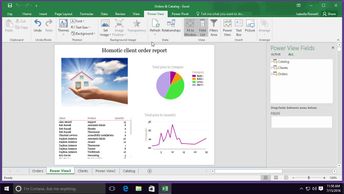
You can use the Power View add-in to create reports in Excel 2016. Discover the capabilities of Power View, including illustrating and organizing reports, filtering data, and adding PivotTables and charts to reports.


Objectives

Excel 2016: Using the Power View Add-in

  • Activating Power View
  • Creating a new report
  • Managing your report tables
  • Grouping data with tiles
  • Creating relationships between tables
  • Illustrating your Power View report
  • Formatting your Power View report
  • Organizing your Power View report
  • Filtering the data in your report
  • Using the advanced filter options in your Power View report
  • Reusing a table
  • Using a Matrix Table to visualize your data
  • Using bar & column charts to visualize your data
  • Using line charts to visualize your data
  • Using scatter charts to visualize your data
  • Using pie charts to visualize your data
  • Visualizing your data in map form