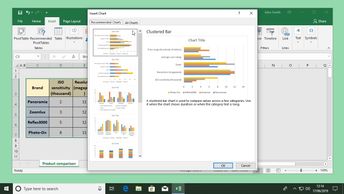
Excel offers a variety of different chart types and styles for presenting and analyzing data in attractive and interesting ways. Learn how to insert, format, and manipulate Pie, Radar, Scatter, Bubble, Map, and Combo charts. Key concepts covered in this 6-video course include how to insert and edit pie charts, helpful when working with percentages; how to create and edit scatter charts be used to cross-reference values and combine different data types; land how to create and edit a bubble chart used to cross-reference three different types of information in a single chart. Continue by learning how to create and edit radar charts, which can be used to plot five different data values, and how to combine two types of chart by using the combo chart which you can use to create a graphic that combines multiple data types. Finally, you will observe how to create and edit a map chart for situations when you have data relating to locations, so you can use the map chart to plot values on a geographic display.
| Objectives |
|---|
Excel 2019 for Windows: Working with Different Chart Styles
|


