Collections Essentials Microsoft Office 2016: Intermediate Project
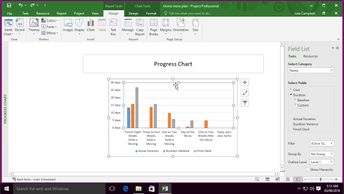
Data is extremely useful, but often you need to visualize the relationships laid out by the data. Discover how to visualize Project data, including working with and formatting tables, charts, and PivotTables.
| Objectives |
|---|
Project 2016: Visualizing Data in Charts & Tables
|