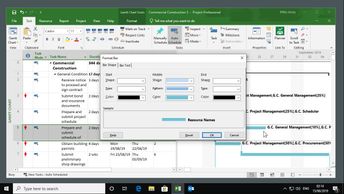
Gantt charts are an invaluable project management visual aid. Learners will discover how to format table text, change chart appearance, format bars, apply bar styles, display progress lines, and draw on Gantt charts in this 6-video course, recorded in a Project Online Desktop Client environment. To begin, you will learn how to format text within a table, which can highlight specific kinds of information in a Gantt chart, and then explore how to modify the appearance of the Gantt chart, changing the color scheme, link styles, and even the gridlines that appear in the chart. In Project, tasks are displayed as bars in the Gantt chart, so you will look at how these bars can be formatted. You can apply bar styles to highlight a particular kind of task in the chart; display progress lines to show how projects are progressing, and finally, learn about drawing on a Gantt chart, where you can add extra information by inserting shapes or text boxes.
| Objectives |
|---|
Project 2019: Using & Formatting Gantt Charts
|